Ready, Dataset, CS:GO: Valve Track Balance Of New Maps
The graphs of wrath
Let's imagine that my time here at RPS thus far can be split into The Wire-style themed television seasons. The first season was all about FIFA and Football Manager and foot-to-ball related things. This second season is all about Counter-Strike: Global Offensive. It's not my fault; I just find it really interesting.
The latest post on the official CS: GO blog details how Valve record data about each new map they add to the game, comparing new additions Cobblestone and Overpass with other official maps.
Overpass is an entirely new map built by Valve, and this graph shows how balanced it is between the two teams.
Terrorists win 50.6% of the time! That's pretty equal.
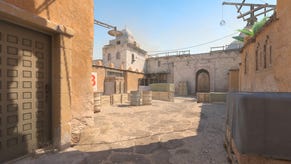
Cobblestone is based on the old de_cbble, a map from the original Counter-Strike mod. Terrorists win a mere 43% of the time. Interesting! Also Aztec is only won by the Terrorists 35.1% of the time. What's your deal, Aztec?
This graph, and the other through at the post, aren't pulled out from the general population but from "the top four skill groups in competitive matchmaking". In that competitive context, it makes sense to value balance between the two teams above all else. As a more casual player of Counter-Strike, I continue to enjoy maps that deliberately place one team at a disadvantage, because I enjoy the extra element of tension and reward introduced by being able to play as the underdog. Believe it or not, earlier versions of the Counter-Strike mod had an almost roleplaying-style element, encouraged by maps like cs_militia, cs_mansion, cs_assault and cs_siege, and the impression that one side was entrenched and the other was, well, screwed.
If this data is used to re-balance Cobblestone, to be fairer to both teams, it becomes a more valid setting for competitive play. But does it become more interesting or more fun, or simply more easily ignored?
The full post has another graph and a download link to the full dataset.


