How to monitor your PC's CPU temperature
Hot blooded? Check it and see


Once you know how to monitor your CPU temperature, you’ll be able to perform a vital health check on a PC component that you very, very much do not want to overheat and break. Luckily this isn’t a common problem, but if you’ve just built a PC from scatch, have installed a new CPU in your existing setup, or are attempting to overclock, checking the CPU temperature is a quick step that can reassure you that all is well – just as much as it can warn you of an overly hot chip.

Excess heat is a PC’s natural enemy, and gaming systems – with CPUs tending towards higher clock speeds, plus dedicated graphics cards producing extra warmth inside the case – are especially at risk. So while overheating is usually caused by an over-ambitious overlock or improperly installed cooler, rather than being part and parcel of computer ownership, it’s worth understanding how to monitor CPU temperatures so that you can spot potential issues quickly. Left unattended, an overheating CPU can cause system shutdowns, performance throttling – less than ideal for gaming – and even permanent damage to the processor itself.
This guide will focus on a few different software tools that you can use to keep an eye on CPU heat. They’re all free and easy to use, and are distinct enough that you can pick the one that best suits your preferences. Just be sure to check in every now and then; even the best CPUs will suffer if they get to toasty.

How to check your CPU temperature with Core Temp
Core Temp keeps everything nice and simple, and provides all you need if you just want to check your CPU temperature now and again to make sure it’s ticking along. It’s easily readable, updates in real time, is compatible with every CPU under the sun and shows you the temperatures of all your processor’s individual cores.
Installing it is dead easy too. Simply click the big blue “Download” on the Core Temp site, then run the executable file once it’s downloaded. While clicking through the installation wizard you will need to uncheck some boxes to avoid adding some bloatware, but otherwise you can keep hitting “Next” until Core Temp is installed.
In the app itself, the temperatures of all your CPU’s cores are listed at the bottom. Another cool aspect of Core Temp – if don’t mind painfully stretching the definition of cool – is that it also lists the lowest and highest temperatures that each core has recorded during the current session. That might be handy if, say, you want to know how high your core temperatures peak during sustained play, but you can’t be bothered with constantly alt-tabbing out to monitor it.

How to check your CPU temperature with HWMonitor
CPUID’s HWMonitor performs a similar role to Core Temp, providing both minimum and maximum CPU core temperatures as well as current readings, but goes into detail on a far greater variety of your PC’s trackable metrics. Want to know the speeds of every single on of your PC’s fans, while also monitoring the temperatures of your graphics card and SSD? HWMonitor tracks it all, including voltages, so it’s particularly well-suited to keen overclockers.
To install HWMonitor, head to its page on the CPUID site and click the purple ‘Setup’ button in the lower left. Simply run the installer once it’s downloaded, and then it’s just a case of finding CPU core temperatures in HWMonitor’s long list of sensors. They’ll be underneath your CPU, which is listed as its full product name, then under ‘Temperatures > Cores (Max).' If you’re only interested in CPU temperature monitoring and nothing else, you can always collapse the motherboard, graphics card and storage device sections to make the whole thing easier to read.

How to check your CPU temperature with MSI Afterburner
MSI Afterburner isn’t just for overclocking your GPU. It’s on par with HWMonitor in how many different aspects of your PC it can keep tabs on, and makes it easy to add your choice of metrics to an unobtrusive overlay that you can check while playing games. That naturally includes CPU temperature monitoring, though setting it up is a little more involved, so let’s break it down into steps:
Step 1: Go the MSI Afterburner page and click “Download Afterburner.” You’ll begin downloading a .zip file.
Step 2: Extract the file and launch the setup application inside. Click through the wizard and on the “Choose Components” section, make sure you leave RivaTuner Statistic Server checked, as you’ll want this installed as well.
Step 3: Once both components are installed, launch Afterburner and click the cog symbol on the left sidebar to open up the properties menu.
Step 4: Open the Monitoring tab and scroll through the list of “Graphs” until you reach the CPU Temperature option. Click this, then check the “Show in On-Screen Display” box in the section below. The words “in OSD” should then appear next to “CPU temperature” in the graphs list.
Step 5: Optionally, you can enter the On-Screen Display tab and set hotkeys to toggle/display the overlay, so that you can control when it appears and when it’s hidden. Either way, click “OK” at the bottom of the properties menu to save your changes.
The next time you launch a game, Afterburner should then display a reading of your CPU temperature in the corner of your screen.

How to check your CPU temperature with NZXT Cam
If you fancy your CPU temperature readout in a more graphical style, NZXT Cam is a good bet. I wasn’t initially impressed when, several years ago, it launched in support of some broadly overpriced NZXT cases (even though you don’t actually need any NZXT hardware to install it). Nowadays, though, it’s a nicely comprehensive (and readable) set of tools for monitoring temps, speeds and loads, not to mention tinkering with compatible lighting and even overclocking.
For simply checking your PC’s CPU temperature, though, you can just take a peek at the default “PC Monitoring” tab, which appears as default whenever you open CAM. To install, simply hit “Download CAM” on the NZXT CAM site and run the executable once it downloads.
Frequently Asked Questions
What is a good CPU temperature?
Generally, a CPU will be perfectly happy running at temperatures anywhere up to the 70-80°c range, even under sustained load. 80-90°c is a technically safe range as well, though anything above that can cause throttling, slowing your PC down in the process. Running at 95-100°c is just asking for trouble, as CPU manufacturers build their chips with heat limits so that they’ll shut down if they spend too long around boiling point. Try to persist with such high temps, and you risk doing terminal damage to your hardware.
Take note that different games put different amounts of strain on the CPU, so it might run hotter in some compared to others. That’s fine, but ideally core temperatures should avoid exceeding 80°c for any lengthy period of time. And if you can get them down even further than that, great – a cooler PC is a quieter one.
How do I lower my CPU temperature?
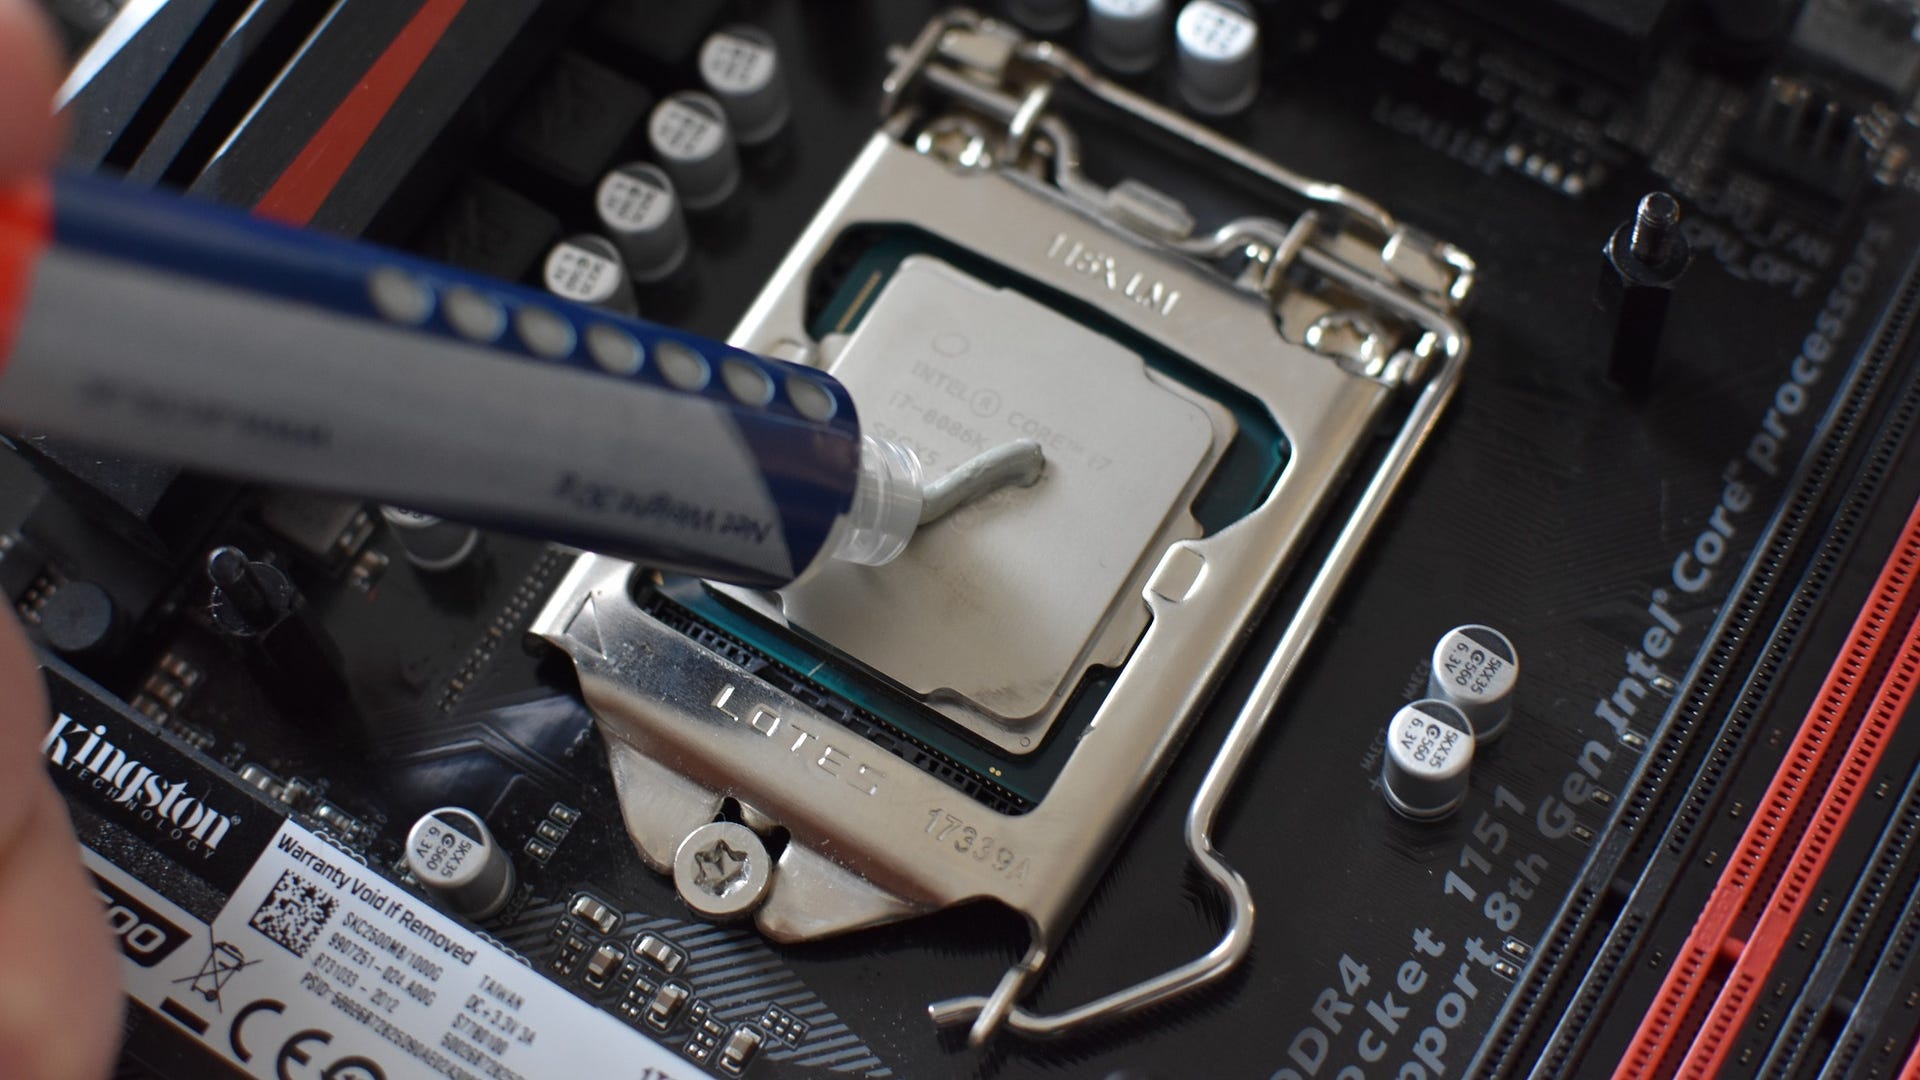
If your CPU is registering uncomfortably high temperatures even when it’s running at stock speeds, there are a few measures you can take. One is to re-apply the thermal paste between the CPU and its cooler; sometimes, the paste may have been applied too thinly or slathered on too thick, preventing effective heat transfer to the cooler in both cases. Thermal paste can also dry out a few years after application, so a fresh coat could help lower temperatures on older builds too. Our guide on how to install a CPU shows how best to apply thermal paste, but in short, you want a very thin, even layer that completely covers the top of the CPU.
If that doesn’t work, you may need to upgrade your CPU cooler. There’s no shame in this – some modern chips, like the Intel Core i9-12900KS, can get extremely hot even at stock speeds, and thus require a powerful liquid cooler to perform at their best.
You could also try lowering the overall temperature of your PC’s interior, such as by installing new case fans. This won’t cool the CPU directly, but it could reduce the ambient heat building up inside the case, which in turn makes everything – the CPU, the CPU cooler, the graphics card – hotter as well.
All three of these might help when overclocking CPUs, as well as when running stock speeds; if anything you should only start overclocking once you already have a highly capable cooling system. But if all that fails, and your OC’d chip is still overheating, you may have to bite the bullet and simply reduce the clock speeds and/or voltages until temperatures are back under control.
For more on keeping your gaming PC in tip-top condish, check out our guides on how to clean your PC, and how to test RAM and find errors. Our liquid cooling vs air cooling guide can also help you decide which kind of CPU cooler you'll need.